Reinforcement Learning · Alignment · Text-to-Image
Z-Reward: Internalizing Reasoning into Score Distributions for T2I
Z-Reward predicts a distribution over rubric scores instead of one scalar. A 9B student hits 88.6% human-preference accuracy with a single output token, and downstream T2I tuning gains 41.3% net GSB over SFT.
Quick answer
Z-Reward is a text-to-image reward model that predicts a full distribution over rubric scores instead of emitting one scalar number. The 27B teacher, trained with Group-wise Direct Score Optimization (GDSO), reaches 89.6% human-preference accuracy; a distilled 9B student reaches 88.6% while emitting a single token at inference. When that reward drives image post-training, the authors report a 41.3% net Good-Same-Bad (GSB) improvement over the SFT baseline. The pitch is calibration and efficiency: keep the signal a reasoning model would produce, drop the reasoning cost at serving time.
Why scalar rewards lose information
A standard reward model collapses a judgment into one number. That number is what RLHF or GRPO-style optimizers chase, but it throws away two things that matter for images: how confident the judge is, and how far apart two candidates really are. Two generations rated 4.0 and 4.2 on a 5-point scale carry a tiny, noisy gap; a scalar head treats that gap the same way it treats 2.0 vs 4.5. Annotator disagreement disappears too.
Z-Reward keeps the judgment as a probability distribution over a 9-level half-point scale (1.0 to 5.0) across four rubric dimensions: text-image alignment, realism, aesthetics, and physical plausibility. The distribution encodes uncertainty directly, and its expectation gives a smooth scalar for optimization while the shape stays available for supervision. That is the core bet of the paper.
How GDSO trains the teacher
Group-wise Direct Score Optimization is the teacher objective, and it stacks three signals rather than one. There is a policy-gradient term computed from the expectation of the predicted distribution, which is what connects a reasoning chain to a usable reward. On top of that sit two supervised terms: a pointwise cross-entropy loss that pins each score bin to the human label, and a pairwise term that forces the predicted score gap between two images to match the annotated gap. The pairwise piece is the part that makes the model rank correctly even when absolute calibration drifts.
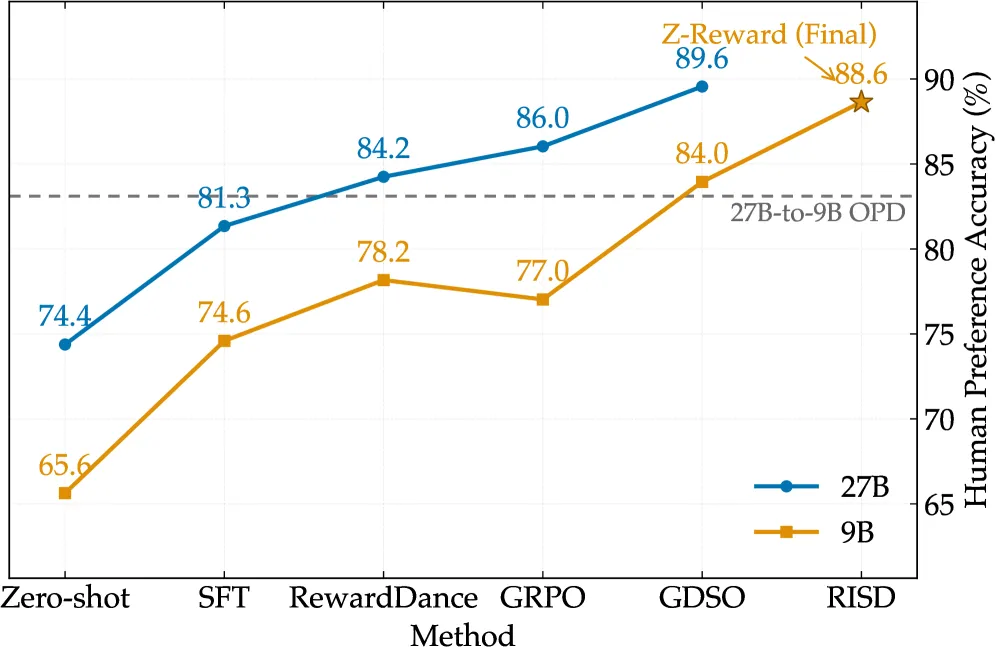
The teacher is a 27B vision-language model that reasons before scoring. On the internal annotated test set it reports 89.6% human-preference accuracy (HPA), with PLCC 0.7620 and SRCC 0.7132. Against the baselines on the same setup that is a real margin: SFT scores 81.35% HPA, RewardDance 84.25%, and a GRPO-style reward 86.04%. So roughly three to eight points of HPA come from the distributional objective rather than from a bigger model or more data.
Key results
- Teacher (27B, GDSO): 89.6% human-preference accuracy (HPA), PLCC 0.7620, SRCC 0.7132, on the internal four-dimension test set.
- Student (9B, RISD): 88.6% HPA (PLCC 0.7391, SRCC 0.6882) with a single output token at inference, within ~1 point of the teacher.
- Reward baselines, same setup: SFT 81.35%, RewardDance 84.25%, GRPO-style reward 86.04% HPA, all below the 89.6% teacher.
- Distillation ablation: RISD 88.64% HPA at 1 token vs on-policy distillation 83.11% at ~750 tokens.
- Downstream T2I: 41.3% net Good-Same-Bad (GSB) human preference over the SFT generator baseline.
Read each number against its setup. The HPA and GSB figures are graded on the authors’ own rubric and annotators, so they show the method is internally consistent and better than its baselines here, not that the figures transfer to a public benchmark or another generator.
What RISD actually distills
Reasoning-Internalized Score Distillation (RISD) is the move that makes this deployable. The teacher’s value comes from reasoning over the image before it commits to a distribution, but running a reasoning chain for every reward call is expensive in an RL loop. RISD trains a 9B student to match the teacher’s reasoning-conditioned score distribution through a KL term, without producing any explicit reasoning text at inference. The student emits one token.
The result is the surprising detail: the 9B student hits 88.6% HPA (PLCC 0.7391, SRCC 0.6882), within a point of the 27B teacher. The ablation against on-policy distillation (OPD) is the cleanest evidence that distilling the distribution, not the text, is what works. OPD, which keeps explicit reasoning, lands at 83.11% HPA and spends about 750 output tokens per score. RISD reaches 88.64% with a single output token. Same student size, same teacher; the difference is whether you copy the reasoning trace or the distribution it produces.
Where the downstream number comes from
The 41.3% net GSB improvement is the headline most readers will quote, and it deserves a guardrail. GSB is a human side-by-side preference (Good minus Bad, normalized) comparing images from the post-trained generator against the SFT baseline. It measures whether the reward, used as an optimization signal, produces images people prefer. It is not a reward-model accuracy number and not a standard automatic metric like FID or a GenEval score. So the result says the reward is a better optimization target than the SFT starting point under their own human eval, which is the right thing to test, but it is graded by the same kind of preference judgment the reward was trained on.
Limits and open questions
The biggest gap is external benchmarks. Accuracy, correlation, and GSB are all measured on an internally annotated test set with the authors’ four-dimension rubric. There is no public preference benchmark, no FID/CLIPScore/GenEval cross-check, and the rubric itself was designed in-house, so it is hard to know how the 89.6% and 41.3% travel to another team’s data or another generator.
Cost is the second question. The student is cheap at inference, but training the 27B teacher with reasoning plus distilling into the 9B student is a two-stage pipeline that needs rubric-aligned distributional labels at scale. The paper does not show whether a smaller teacher or coarser scale degrades the gain.
Third, the GSB win is reported against an SFT baseline, not against a strong RLHF generator tuned with RewardDance or GRPO rewards. So the cleanest claim is “better than no reward,” and the more interesting comparison, distributional reward versus a strong scalar reward in the same RL loop, is left to the reward-accuracy table rather than the generation eval.
Builder takeaway
If you run a T2I post-training loop and already have rubric-style human labels, the distributional reward plus RISD is worth reproducing: you get most of a reasoning judge’s quality at one-token serving cost. If you only have binary preference pairs and no per-dimension rubric, the GDSO supervision terms do not apply cleanly, and a standard scalar reward may be the faster path. Teams without an internal annotation pipeline should wait for a public benchmark before trusting the exact numbers.
FAQ
What is Z-Reward and how does it differ from a scalar reward model?
Z-Reward predicts a probability distribution over a 9-level rubric score (1.0 to 5.0) across four dimensions instead of one scalar. The distribution keeps annotator uncertainty and the size of the gap between candidates, and its expectation still gives a smooth scalar for optimization. A scalar head throws that information away.
How does Z-Reward’s 9B student reach 88.6% accuracy with a single token?
Reasoning-Internalized Score Distillation (RISD) trains the 9B student to match the 27B teacher’s reasoning-conditioned score distribution via a KL loss, so the student never has to generate a reasoning chain. It emits one token at inference and lands at 88.6% human-preference accuracy, within a point of the teacher’s 89.6%.
Why does RISD beat on-policy distillation for Z-Reward?
On-policy distillation keeps explicit reasoning text and reaches 83.11% accuracy at about 750 output tokens per score. RISD distills the distribution itself, not the text, and reaches 88.64% with one token. The ablation shows the reasoning’s value lives in the score distribution it conditions, not in the chain being reproduced.
Does the 41.3% GSB improvement prove Z-Reward beats other RLHF rewards for text-to-image?
No. The 41.3% net Good-Same-Bad improvement is a human side-by-side preference measured against the SFT baseline, so it shows the reward is a useful optimization signal versus no reward. It is not measured against a generator tuned with RewardDance or GRPO rewards, and there is no FID or GenEval cross-check.
One line: Z-Reward keeps the calibration of a reasoning judge while serving at one-token cost, but every headline number is on an internal rubric, so reproduce the pipeline before trusting the figures. Read the original paper on arXiv.